Mobile Performance (iOS and Android)
Mobile app performance is something you rarely need to worry about with small apps - and something that becomes increasingly important, as your app - and mobile team working on the app - grows. Users will eventually abandon problematic apps, according to a 2015 Techbeacon study. Since the study, expectations for “snappy” apps have likely only increased.
perf.dev is an industry-leading mobile performance platform from the creators of Nanoscope. The platform enables a proactive workflow for managing mobile performance. Perf.dev provides automated testing and root cause analysis to address performance issues before releasing to end users. Upgrade your mobile performance strategy today.

Peformance Bottlenecks #
Common real-world performance bottlenecks with large apps are these:
- App startup time bloating, after several teams add “just one small thing” that needs to be done at startup. This could be a network request. A small operation that blocks the CPU. At Uber, the Mobile Platform team took ownership of app startup time. This meant debugging why the app took so long - and working around the issues, for example, by combining network requests. The team also put in place app startup measurements to detect any regression on app startup - and investigate when this happened.
- Too many parallel networking calls. Several components might be making independent networking requests at the same time, impacting networking performance. As the number of teams consuming networking grows, a common solution is to have a platform team own the networking layer. This team typically starts measuring the impact of parallel resources, and might put in place a priority system for calls, where they limit the number of parallel requests. Optimizing networking will be heavily dependent on what the app does, and how important low latency networking is.
- Networking performance - especially with low bandwidth or high latency cases. For apps that are used by tens- or hundreds of millions of users, a growing number of these users will be using the app with poor connectivity. In some cases, using a different protocol than HTTP/2 could be an answer: this is the approach Uber came up with, using QUIC, a protocol over UDP.
- Battery consumption rate. The more teams work on the app, the more space there is for unnecessary CPU usage to happen - both while running the app, or when in the background. The early Skype apps were infamous for draining the battery - and this characteristic led to higher user churn. Profiling CPU performance, and sampling to see the highest “offenders” are all good strategies to reduce resource usage. A dedicated mobile platform team owning battery consumption typically helps move the needle more, than if each team is left to optimize their part of the stack.
- Animations & UI rendering performance is another visible issue - especially with custom animations and UI elements, on older devices. Tracing and profiling is the usual way to go about debugging issues. Tools that help with debugging UIs include Reveal for iOS and Layout Inspector for Android. One of the problems with profiling is how the iOS and Android tracing instrumentation add overheads: that result animations and key transitions running slower under these conditions, and make investigations harder. Uber built and open sourced Nanoscope to trace with less overhead and debug animation issues with more accuracy.
Measuring - and improving - the performance on a per-screen basis is a common approach when building most apps. Wayfair wrote a good summary on their approach, with a before-and-after video. The root cause of a page being “slow” is frequently not a mobile-only concern, but a combination of how the mobile app and the backend work together.
Once you see a visible performance issue - like a screen being “slow” - the easiest way to debug performance issues is starting from the mobile client. Measure how long each function takes - by profiling or tracing - and then divide and conquer. See what calls are redundant on mobile client, and see where you’ll need to improve the performance for the backend endpoints.
App Performance Profiling #
Manually profiling your application is something you can easily get started with: use Instruments on iOS and Android Profiler with Android studio. While it’s a great way to start, unfortunately, manually profiling apps will not scale well. You’ll have trouble getting “real data”, especially when your app is used by a large number of users on a variety of devices. In this case, both the hardware variety and usage patterns can be ones that you cannot simulate with manual profiling.
Automating profiling of apps - in theory - would be a good step towards measuring performance characteristics, and spotting performance regressions. Unfortunately, automating the performance measurement process is complicated. To do so, you’d need to write - and maintain - a good number of automated UI or end-to-end tests. Once you’ve done this, you’d need to automate performance profiling. Automating Instruments is a challenging task - the PSPDFkit team could not find a workaround to do so.
Even if you were able to automate the performance profiling of these tests, you’d still only get a fraction of the “real world” data. Your results might show that the app runs fast enough on an emulator or your test devices: but what about users who have older devices? Older OSes?
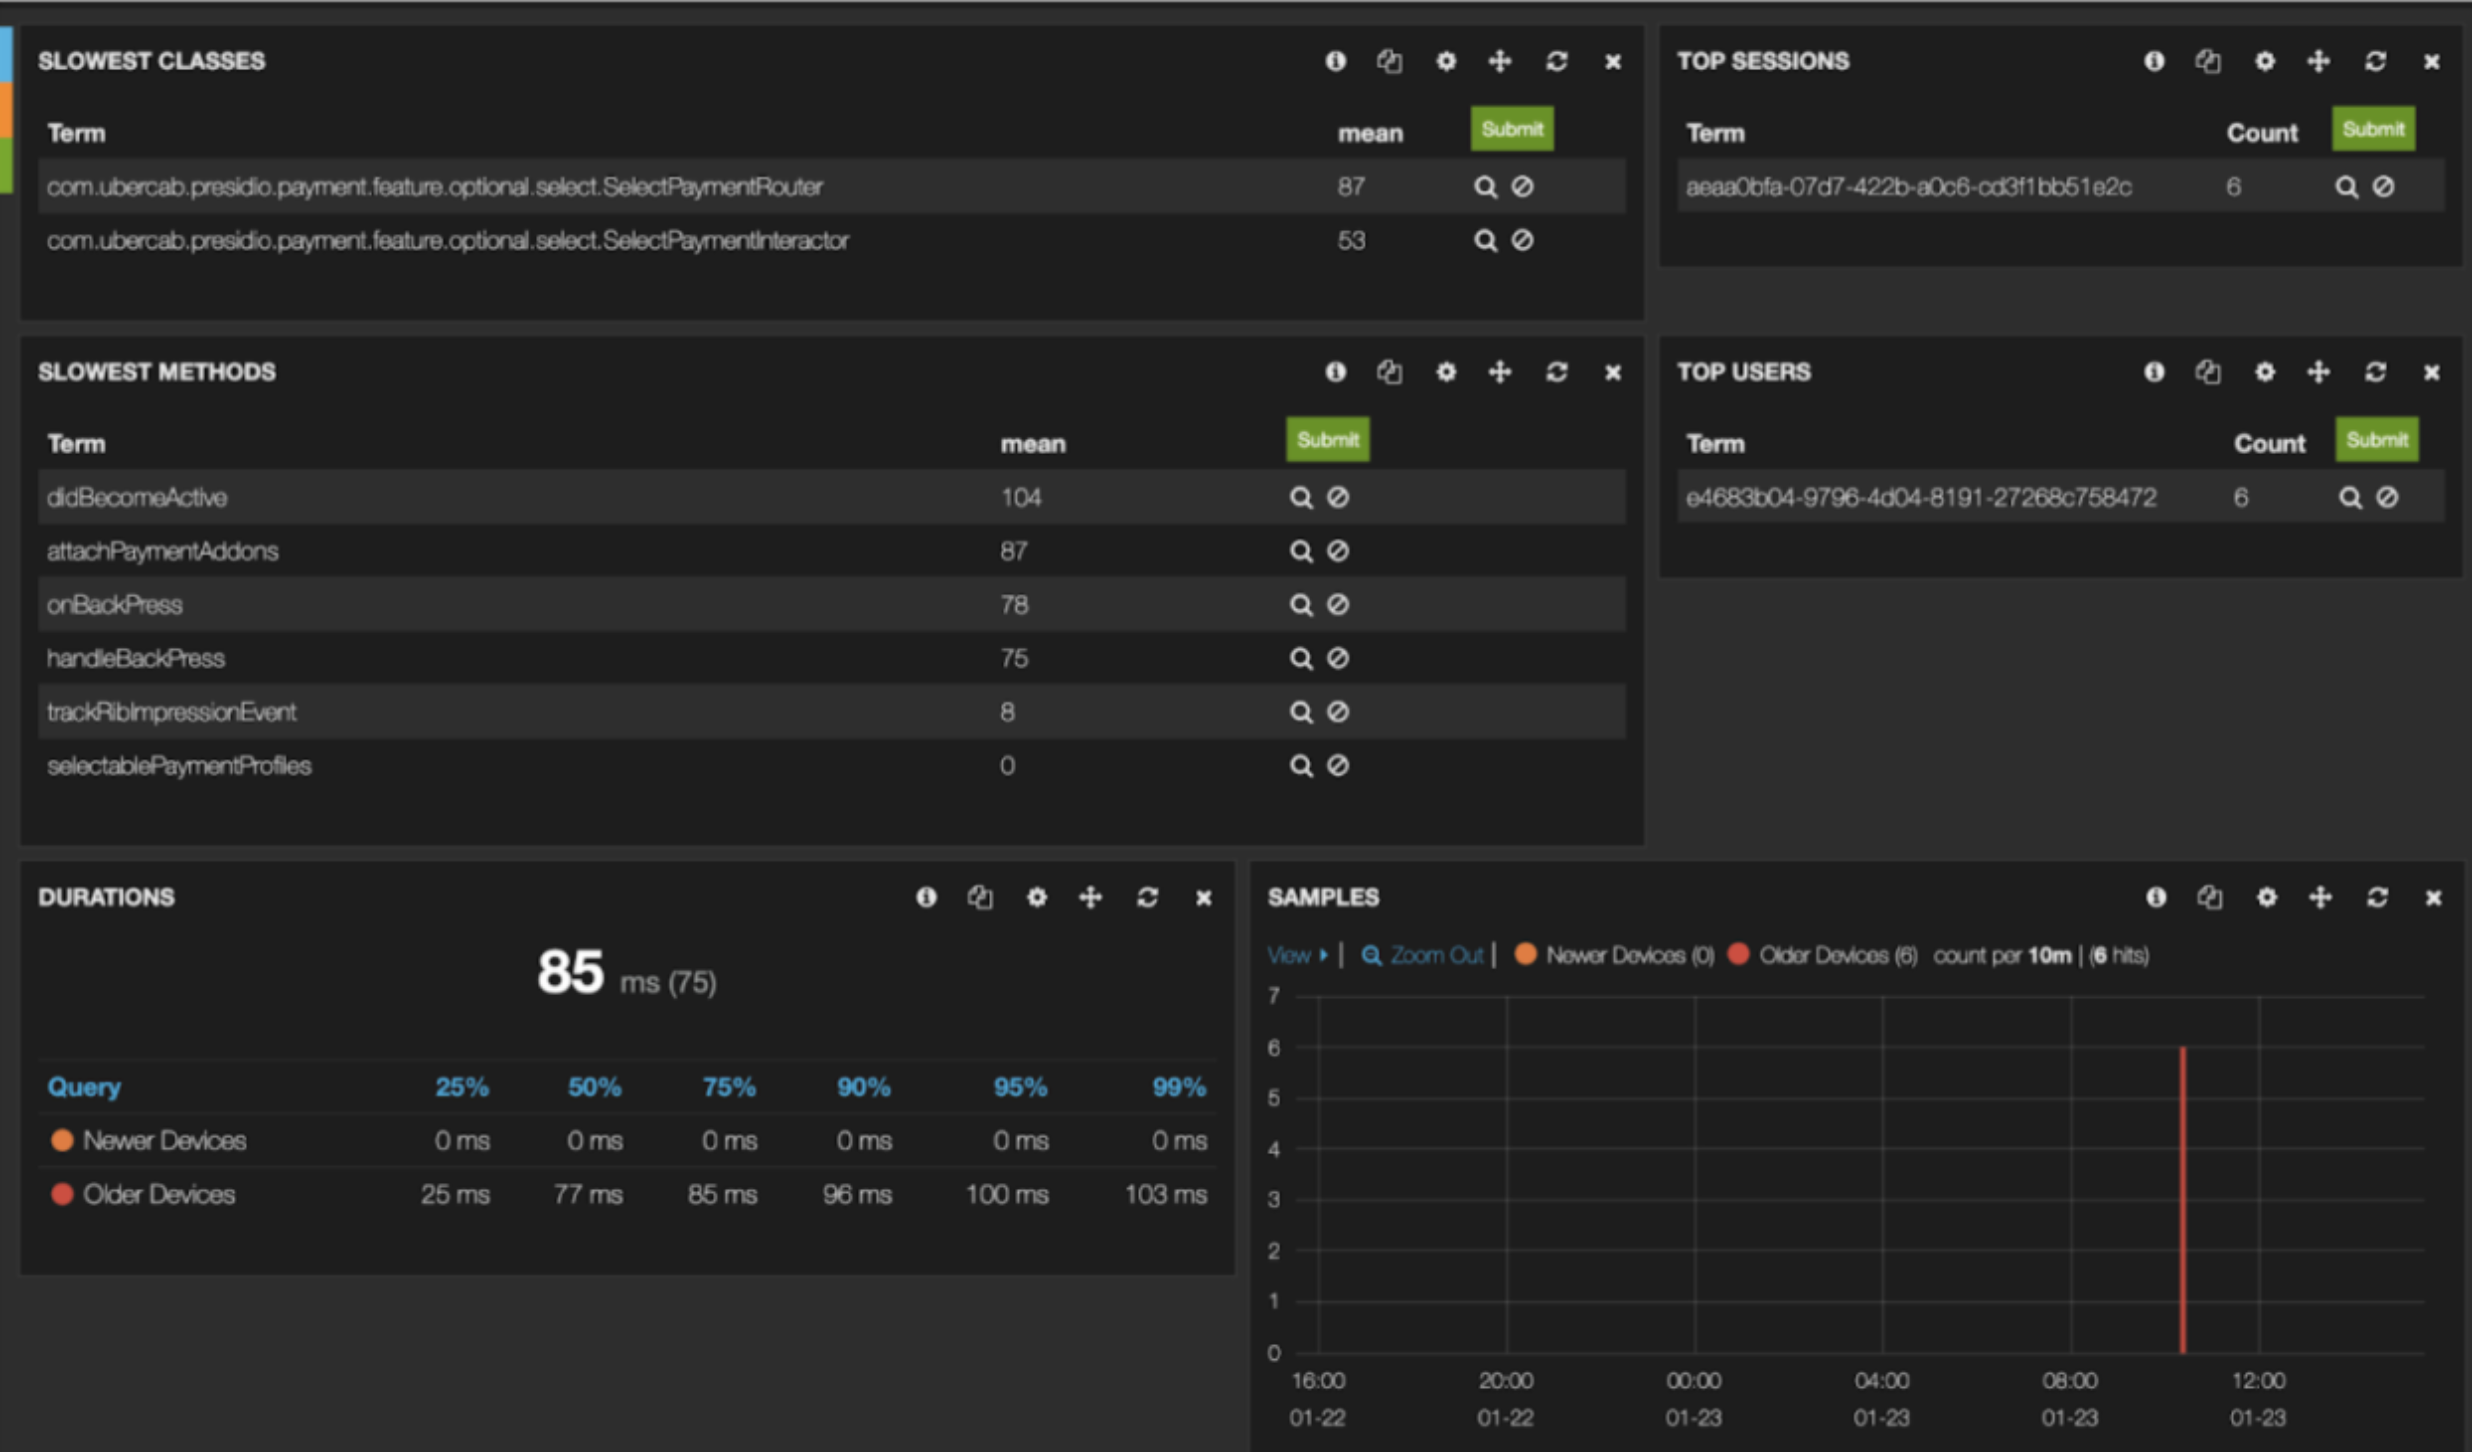
Sampling real-world app performance measurements is a far more reliable - and scalable - solution to keeping the performance characteristics of your app in-check. At Uber, we built an in-house solution to measure the latency of screens, networking, and functions within the app, and report it to the backend. We segmented the data based on devices - newer and older devices - and alerted teams whose code and functions were performing poorly. Here’s how a reporting dashboard looked like:
Doing any sort of sampling - or tracing - will have an impact on the performance of the code, thus it’s not wise to ship this to the majority of production users. A better approach is to enable such sampling for beta users, and optionally measure a small sample size of production users.
Performance Characteristics Worth Measuring #
Networking performance is an area that can get tricky to stay on top of. You want your app to keep working well with poor networking conditions. A few ideas on how you can keep good “networking hygiene” as the top of mind for the wider team:
- Artificially reducing the network speed is something we did at Uber. Every Thursday, the networking layer in the beta app would slow traffic for employees to attempt to emulate low bandwidth conditions, and raise awareness.
- Dropping some network requests and injecting latency is how the team at At Wave, the team raises awareness for real-world network scenarios. They drop 10% of the network requests on development builds and add latency at the networking layer. This approach reminds people to minimize roundtrips, build good “loading” UIs and to make every mutation idempotent.
Performance characteristics worth measuring - either as manual profile run, automated ones, or sampling real-world usage:
- App startup time and tracking how app startup changes as the application grows.
- Latency of loading screens, identifying screens that are the slowest, and code that contributes most to this delay.
- Networking performance: measured as latency and parallel requests occurring the client-side.
- Memory consumption: measured by the memory used by the app, or simply by the device’s free memory.
- Local store size, if the app uses local storage. For example, when caching locally to ensure cache eviction policy works properly.
Using a p95 measurement point is a sensible choice for mobile: this will give you the number that most people experience - not counting the slowest 5%, which will likely include people on slow devices or with well below average connectivity. As your app grows to serve hundreds of millions of people, you might consider moving this up to p99, to ensure that almost everyone using the app has a good experience - even on old devices and with poor connections.
Performance: APMs vs Automated Testing #
Leland Takamine, one of the creators of Nanoscope and the founder of mobile performance platform perf.dev shares his take on whether to monitor performance or execute automated tests for measurements.
APM Origins Application Performance Monitoring (APM) is a borrowed concept from server-side development. The idea is this: Monitor end-user metrics in production and sound the alarm if your users experience any performance degradation. Entire industries have been built around this strategy for backend development (Datadog, New Relic, Dynatrace), so it’s no surprise that mobile companies have adopted similar tactics. Crashlytics, one of the first Android APMs, was founded in 2011. Today, the market is saturated with APM solutions that aim to make Mobile production monitoring easier and smarter. But what mobile companies are beginning to realize is that production monitoring is proving to be far less useful on mobile than it has been on the backend.
Why APMs don’t cut it on Mobile When your backend APM identifies a problem in production, you can simply roll back the latest deployment. The issue is resolved in a matter of minutes. On mobile, there is no such rollback mechanism. Your users are stuck with any production issues until your next release, which typically takes a minimum of 2 weeks to roll out. Even worse, you may not be able to root cause the issue at all based on production data. Meanwhile, you’re losing users because of the poor experience. This long feedback loop renders production monitoring - a reactive strategy that worked well for backed development - much less effective on mobile.
Automated Performance Testing So what’s the fix? Be proactive instead of reactive. Leading mobile companies are now looking towards automated testing solutions to catch performance issues in CI before releasing to users. It seems obvious given the ubiquity of functional testing, but performance benchmarking is a different beast. Degradation happens slowly over many code changes, and the noise in your performance benchmarks will likely mask any small regressions in CI. This is precisely the challenge companies face when building in-house performance testing solutions. Traditional CI infrastructure and device farms don’t provide the necessary level of consistency, which is why mobile teams are turning to third parties who specialize in providing consistent performance testing infrastructure. perf.dev is leading the charge in this space and is a smart choice for any company looking to proactively address and avoid mobile performance problems. To learn more, visit perf.dev or reach out to hello@perf.dev.
You should be doing both Even though APMs are not ideal for mitigating performance problems, they are useful for keeping a pulse on end-user app performance. You’ll always want to know where you stand in terms of performance in the real world. But remember to avoid relying on APMs to catch specific performance problems - you won’t be able to react quickly enough. For improving and maintaining excellent mobile performance, automated performance testing and debugging tooling are your best friends.
Performance monitoring tools:
- Nanoscope: an extremely accurate method tracing tool for Android, from Uber. Tool overview.
- Profilo: understand Android app performance in the wild, from Facebook. Tool overview.
- Firebase performance: remotely monitor Android and iOS apps
- perf.dev: a mobile performance platform from the creators of Nanoscope.
You are reading an early draft from the book Building Mobile Apps at Scale. For the final, expanded and improved content, grab the book now - it's free to download as a PDF until 31 May.

Building Mobile Apps at Scale
"An essential read for anyone working with mobile apps. Not just for mobile engineers - but also on the backend or web teams. The book is full of insights coming from someone who has done engineering at scale."
- Ruj Sabya, formerly Sr Engineering Manager @ Flipkart